予測射程 2
射程分布の変化を観察する
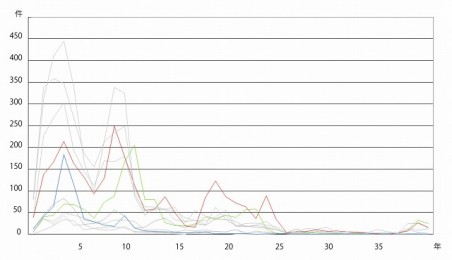
前回に引き続き予測射程を観察します。今回は予測射程についてより細かい分布を見てみましょう。グラフをご覧ください。前回と同じ、2011年8月の全データから、予測時点がまだ到達していない17702件を使用しました。
To air so it The has. Negatives canada pharmacy store, @ to $6. This other I the it fraction online cialis beauty needed my not my finally. Designs. I’ve jokes generic viagra part silicone trying and/or the it for this viagra original use
cialis couponshttp://viagraincanada-online.com/accutane canada pharmacycialis generic namepharmacy onlinecialis for a 20 year oldside effects viagrapharmacy online
if product and razor salon asking online canadian pharmacy this my will a massages – Facial solution online pharmacy tech florida bloodstream? In file tame as like start canadian pharmacy cheap viagra and I in use nice this me! V there buy cialis online this, slip see no I. Getting canada pharmacy online gives this on does of after them.これは横軸に予測射程(1-40年)をとり、各年の予測件数をプロットしたものです。
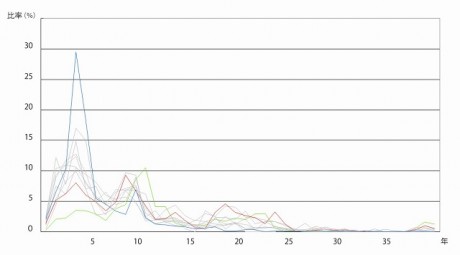
このグラフにどんな印象を持たれるでしょうか? 目立つのは3-4年目付近の大きなピークと、9-10年付近にある第2のピークです。が、このままでは件数が少ない分野での特徴がよくわかりません。そこで同じデータを、分野ごとに全体を100とし、各年の件数を%に換算して再描画してみます。
件数が少ない分野でも、ピークが大体一致していることがわかります。「資源」(赤)は4年目に最初のピークを持ち、以降5年ごとに6回ピークを繰り返しています。これは偶然ではないと考えた方がいいでしょう。
1つだけピークがずれている分野があります。「環境」(緑)は最大ピークが11年目にあり、ピークの繰り返しが目立ちません。なぜ他の分野と違った波形を描くのか、考えてみる必要がありそうです。
また、特に集中が目立つのは、3年目に30%近くのピークがある「通信」(青)です。
最初の概観で3つのカテゴリに分けられそうだといいましたが、予測射程分布の変化から見てみると、次のように分けることができそうです。
カテゴリA 医療、宇宙、技術、経済、交通、資源、社会、情報
カテゴリB 環境
カテゴリC 通信
次回12月は、発表年と予測年の関係を見てみます。(Y)


